Heikin Ashi is a technical trading term used in charting and finance.
It is a charting method that uses smoothing techniques to handle volatile volume prices. As the day goes on, the price will be smoothed out by what it has closed the day before.
The Heikin-Ashi (“smooth and quick”) chart was developed in 1836 by Japanese trader Jōhei Kōya for use on Japanese rice futures contracts. This is one of the first forms of Japanese technical analysis. Around the late 1970s, Heikin-Ashi was further developed by Japanese trader Yamada-San, whose work influenced many to use this charting system.
Traders usually watch price fluctuations in candles. They are looking for patterns or trends that have different shapes and patterns. Traders will look at these charts and try to find a pattern that they can trade on to make money from the stock market. They will use patterns or trends to know when the price will go up or down or when to sell or buy.
Heikin-Ashi is a charting method that uses smoothing techniques to handle volatile volume prices. As the day goes on, the price will be smoothed out by what it has closed the day before.
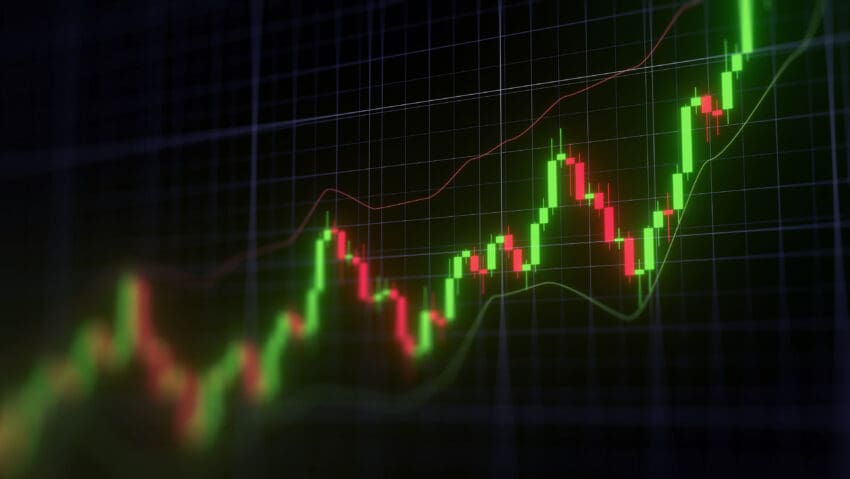
There are three types of candles in Heikin Ashi:
- The green candle: shows the highest high of the last N days closing price(s).
- The red candle: shows the lowest low of the last N days closing price(s).
- The long white candle: shows the highest high of the last N days closing price(s).
Using these candles, traders can see some trends and patterns. For example, when the price goes down from high to low, the market will usually have a green candle. Then if the price goes back up again, it will have a red candle which is lower than its previous day’s close. These candles are recurring in Heikin Ashi.
Traders believe that candle patterns are used to predict future price movements. Though the patterns do not always occur and the shape of the candles can vary, some traders still use this technique because it is seen as a way to predict future price movements. Heikin-Ashi is also used to determine how low or high a market will be about its average or such a market’s general trend. Traders consider the green candle the best choice when determining support or resistance levels. The orange candle is a lower choice for determining support, but when the market is going up in price, it will have a white candle which shows that the high of the day has topped out. This is a good indicator that the stock will be rising soon.
There are many different variations to the Heikin-Ashi technique. Some traders use only red and green candles, while others use a different combination, such as yellow and red.
Heikin Ashi is often used in conjunction with other charts to analyze the market; for example, Heikin Ashi combined with a histogram (see below for more details) can determine support or resistance levels. It can also be used to determine market tops and bottoms, after which price will then move in a different pattern.
The Heikin-Ashi charts use volume bars as vertical lines to help indicate where the highest high (usually in green color) and lowest low (in red color) of the day occurred. Sometimes, to indicate a movement outside of the volume range of the bar, another white line is added below it. Heikin-Ashi charts also use a candlestick with a black body to help indicate the highest high, and lowest low of the day.
The Heikin-Ashi chart displays data that changes over time in some form of trend. It is used to see trends or patterns in price or volume. Heikin-Ashi does not indicate trends as well as other charting techniques.
The Heikin-Ashi chart can be helpful for companies or investors to determine support and resistance levels. Support and resistance levels are lines drawn at a certain price level on a chart to determine points at which traders believe the stock or commodity will either bounce off of it or hit it with enough force that the price will reverse. The Heikin-Ashi chart can also compare price changes from multiple periods. It can be used to determine the potential for a breakout or breakdown and spot market tops and bottoms.
There are several other variations of the Heikin-Ashi chart that many traders use. Some traders wait to see if the candle pattern occurs again to predict price movement or not. For example, a trader may look at a Heikin-Ashi chart and decide that when the lowest low candle occurs over an upside-down candle, they will look for a breakout. Traders often use other technical indicators in conjunction with the Heikin-Ashi chart to spot patterns or trends when trading.
Takagi Masakazu pioneered Heikin-Ashi in his work on exchange rate dynamics of Japan’s rice and wheat production policies, which also led to the development of economic indicators such as the Kōrgen Otsuka Index, which is based on studies of Heikin-Ashi charts.
In 2013, a well-known Japanese trading company, FXOpen, released a real-time Heikin Ashi charting software platform.
A similar approach to the Heikin-Ashi technique was invented in Germany in the late 1970s. This system, called the “Daily Action Chart” by its creator Dr. Michael Lüders, was not published until 1983. It has been used for cultural-critical research and artistic projects by the Westdeutscher Rundfunk (WDR) within various media.
In conclusion, this approach to trading is used by many traders and investors, who use pattern recognition and mathematics to determine support and resistance levels in the market. The Heikin-Ashi technique is one of several available to determine support or resistance levels. It can be helpful for companies and investors to see where the market might bounce off of support or resistance lines, either making a buy or selling for a profit against the current trend.